

Chart patterns play an important role in technical analysis, but they require a certain amount of practice before they can be used effectively. In this article, you’ll find a list of ten chart patterns every trader needs to understand and how they can use them effectively.
The chart pattern is a shape that helps to predict what is likely to happen next, based on what has happened in the past. Technical analysis is based on chart patterns, and a trader must know exactly what he or she is looking at and why.
In fact, there is no ‘best’ chart pattern, since they are all used to highlight different trends in a huge variety of markets. In candlestick trading, chart patterns are often used, which makes it easier to see the previous opens and closes of the market. There are some patterns that are more suitable to volatile markets than others. You can use patterns to predict whether a market will go up or down.
That being said, it is important to be able to identify which chart pattern is suitable for you in your particular market, as using the wrong chart pattern or not being aware of which chart pattern to use can cause you to lose out on an opportunity to profit.
In order to understand different chart patterns, we must first explain support and resistance levels. A support level is the point where an asset’s price stops falling and begins to rise again. A resistance level is where price stops rising and dips back down.
Support and resistance levels appear because of the balance between buyers and sellers, or demand and supply. If there are more buyers than sellers in a market (or if there is more demand than supply), the price tends to rise. The price usually falls when there are more sellers than buyers (more supply than demand).
For example, the price of an asset may increase if demand exceeds supply. However, the price will eventually reach the maximum that buyers will pay, and demand will decrease at that price level. This may lead to buyers closing their positions.
This creates resistance, which starts to cause the price to fall as supply exceeds demand as more and more buyers exit the market. The price of an asset might fall enough for buyers to buy back into the market once the price is now more acceptable, creating a level of support where supply and demand are equal.
As the price rises due to increased demand relative to supply, it will drive the price back to a level of resistance. If a price breaks through a level of resistance, it may become a level of support.
Types of forex chart patterns : everything you need to know
There are three types of chart patterns: bilateral patterns, continuation patterns and reversal patterns
A continuation indicates that a trend will continue. Reversals in chart patterns indicate a change in trend. A bilateral chart pattern signals to traders that the price could move either way – meaning the market is highly volatile. you can take a position on all of these patterns.
Currencies give you the option to go short as well as long – so you can speculate on markets falling as well as rising. It is possible to go short during a bearish reversal or continuation, or long during a bullish reversal or continuation – whether you do so depends on the pattern and market analysis you have conducted.
Using chart patterns as part of technical analysis should not be viewed as a guarantee that a market will move in the predicted direction – they are merely a prediction of what might happen to an asset’s price.
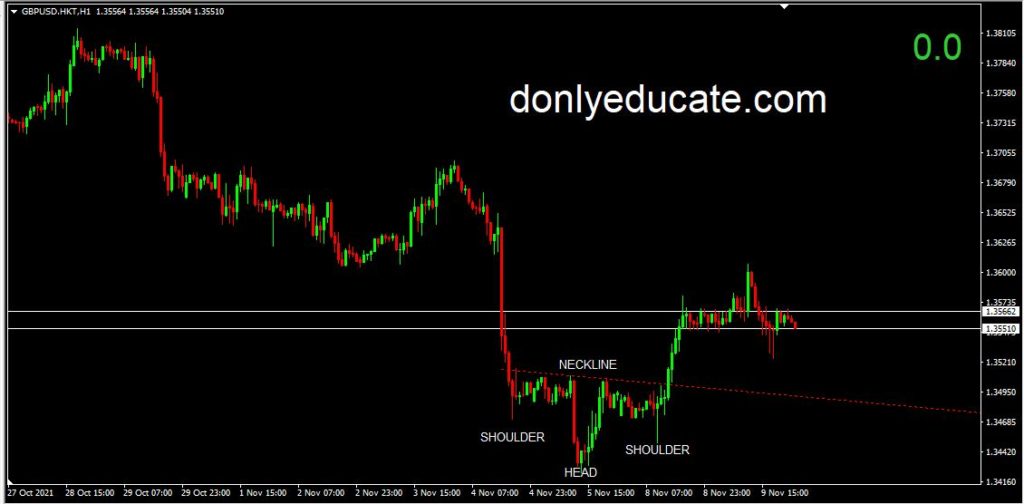
Number 1 : Head and shoulders
Head and shoulders chart patterns consist of a large peak and a slightly smaller peak on either side of it. Traders use head and shoulders patterns to predict a bullish-to-bearish reversal. The first and third peaks are usually smaller than the second, but they fall back to the same level of support, or ‘neckline’. By the time the third peak falls back to the level of support, it is likely to transition into a bearish downtrend.
Head and shoulders chart patterns consist of a large peak and a slightly smaller peak on either side of it. Traders use head and shoulders patterns to predict a bullish-to-bearish reversal. The first and third peaks are usually smaller than the second, but they fall back to the same level of support, or ‘neckline’. By the time the third peak falls back to the level of support, it is likely to transition into a bearish downtrend.
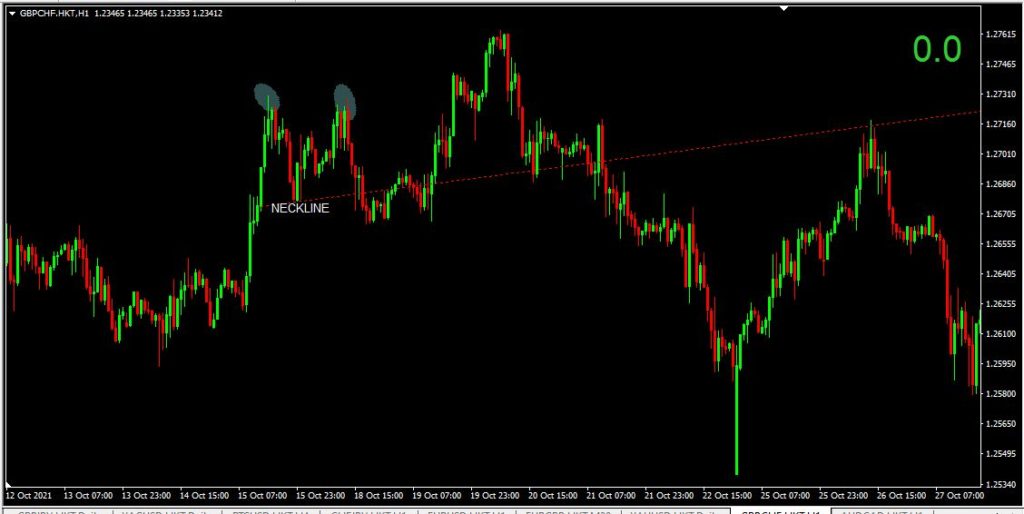
Number 2 : Double top
Double tops are also used by traders to highlight trend reversals. An asset’s price usually reaches its peak before retracing back to its support level. It will then rise once more before reversing back more permanently against the trend.
Number 3 : Double bottom
This chart pattern indicates a period of selling, causing an asset’s price to fall below a level of support. The price will then rise to a level of resistance, before dropping again. Eventually, the market will begin an upward trend as it becomes more bullish. The double bottom is a bullish reversal pattern, since it indicates the end of a downtrend and a shift towards an upward trend.
Number 4 : Rounding bottom
Rounding bottom chart patterns can indicate a continuation or reversal. An asset’s price may fall back slightly during an uptrend before rising again. This would be considered a bullish continuation.
These traders will attempt to profit from this pattern by buying halfway around the bottom, at the low point, and profiting from the continuation once it breaks above a level of resistance.
Number 5 : Cup and handle
A cup and handle pattern indicates a period of bearish market sentiment before the overall trend finally continues in a bullish direction. It is similar to a rounding bottom chart pattern, while the handle is similar to a wedge pattern – explained in the next section.
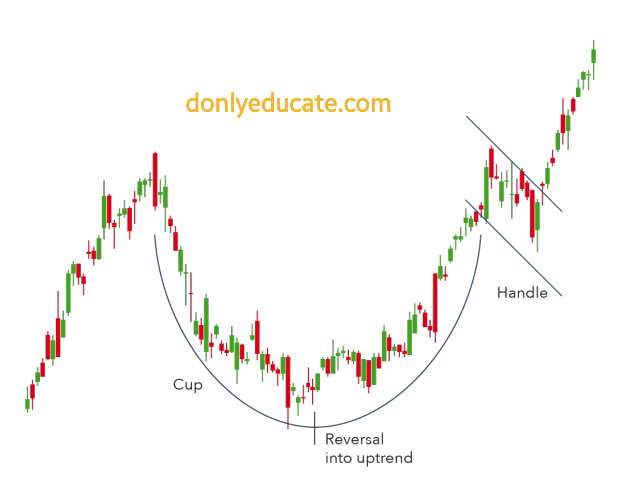
As a result of the rounding bottom, the price of an asset will likely undergo a temporary retracement. This is referred to as a handle because it is confined to two parallel lines on the graph. The asset will eventually reverse out of the handle and continue to trend upwards.
Number 6 : Wedges
As an asset’s price moves tighten between two sloping trend lines, wedges form. There are rising and falling wedges. A rising wedge is a trend line that is caught between two upwardly slanted lines of support and resistance. The support line here is steeper than the resistance line. Generally, this pattern indicates that an asset’s price will eventually decline more permanently – that is, when it breaks through the support level.
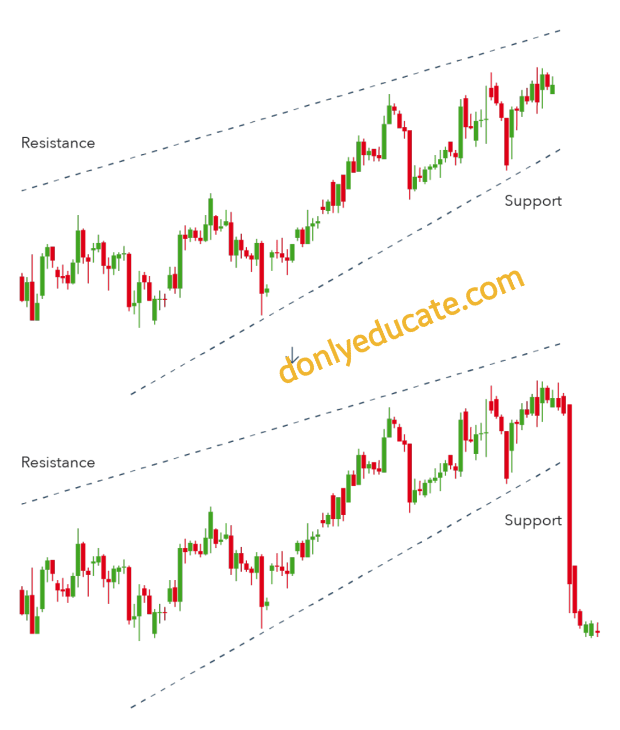
A falling wedge occurs between two downward-sloping levels. Resistance line is steeper than support line. In the example below, a falling wedge indicates that the asset’s price is likely to rise and break through the level of resistance
Rising wedges indicate a bearish market while falling wedges indicate a bullish one.
Number 7 : Pennant or flags
Pennant patterns are created after an asset experiences an upward movement followed by a consolidation. During the early stages of the trend, there will be a significant rise before smaller upward and downward movements.
A pennant can be either bullish or bearish, and it can represent a continuation or a reversal. The chart above illustrates a bullish continuation. Pennants can be considered bilateral patterns as they show either continuations or reversals.
Although a pennant may look like a wedge pattern or a triangle pattern – explained in the sections following – it is important to note that wedges are narrower than pennants and triangles. A wedge will always be ascending or descending whereas a pennant will always be horizontal.
Number 8 : Ascending triangle
An ascending triangle is a bullish continuation pattern that signals the continuation of an uptrend. Triangles can be drawn on charts by placing a horizontal line along the swing highs – the resistance – and drawing an ascending trend line along the swing lows – the support.
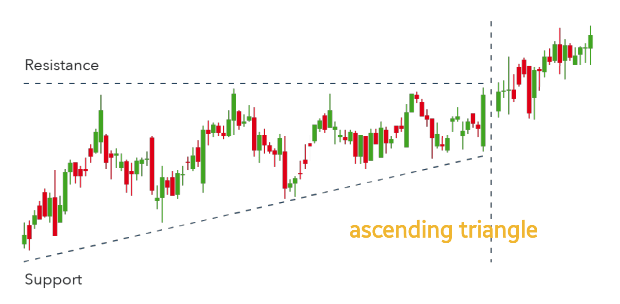
In ascending triangles, there are often two or more identical peak highs that allow the horizontal line to be drawn. The trend line indicates the overall upward trend of the pattern, while the horizontal line indicates the historical level of resistance for the asset in question.
Number 9 : Descending triangle
n contrast, a descending triangle signals the continuation of a downtrend. The trader enters a short position during a descending triangle – possibly with currencies – in an attempt to profit from a falling market. When descending triangles break through support, they indicate a market dominated by sellers, which means successively lower peaks are likely to prevail and unlikely to reverse.
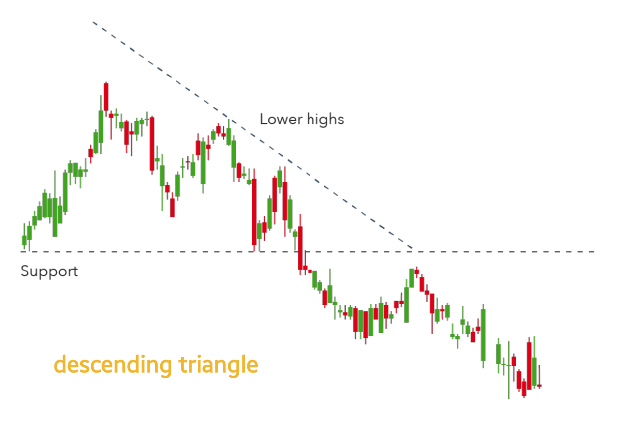
The descending triangle can be identified by a horizontal line of support and a downward-sloping line of resistance. Eventually, the trend will break through the support and the downward trend will continue.
Number 10 : Symmetrical triangle
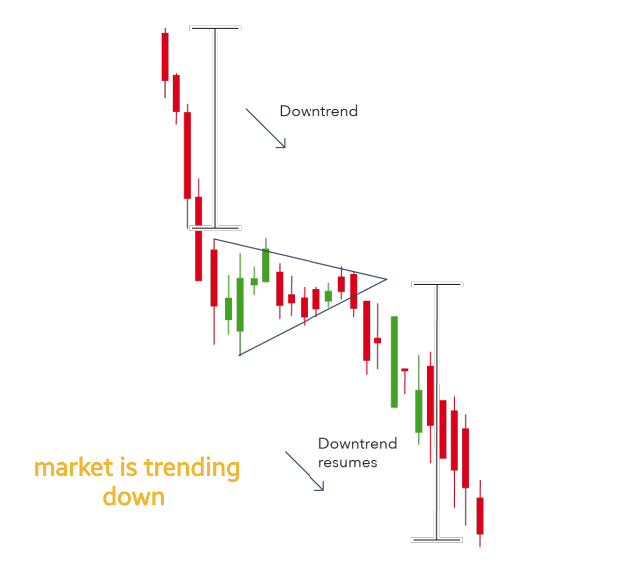
The symmetrical triangle pattern can either be bullish or bearish, depending on the market. In either case, it is usually a continuation pattern. This means the market will usually continue in the same direction as the overall trend once the pattern has been formed.
A symmetrical triangle is formed when price converges with a series of lower peaks and higher troughs. As you can see in the example below, the overall trend is bearish, but the symmetrical triangle indicates that there has been a brief period of upward reversals.
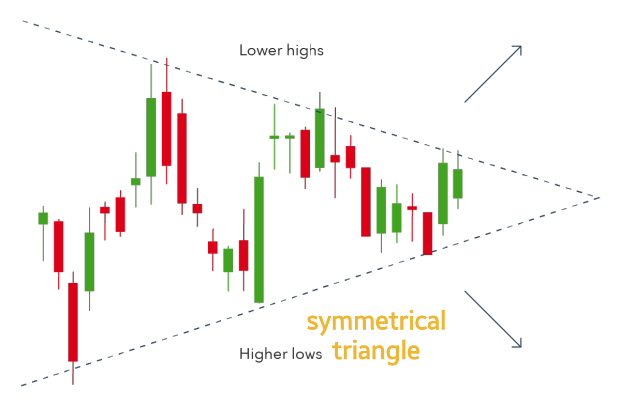
If there is no clear trend before the triangle pattern forms, the market could break out either way. A symmetrical triangle is therefore a bilateral pattern – meaning they are best used in volatile markets where it is unclear which way an asset’s price will move. Below is an example of a bilateral symmetrical triangle.
Summary
Each of the patterns explained in this article is a useful technical indicator that can help you understand how or why an asset’s price moved in a certain way – and how it might move in the future. Chart patterns can be used to highlight areas of support and resistance, which can help traders decide whether to open long or short positions; or whether to close their open positions if a trend reversal is imminent.
Also Read – Top 8 Best forex trading platforms Australia